S&P PRISM® Index
%
Objective
Seeks to look beyond volatility, evaluate several market indicators and strategically allocate for diversification and consistent performance.
Approach
Multifaceted, rules based strategy that takes into account key market indicators, risk and momentum.
Holdings
Diversified asset classes across US Equities, US Bonds and Commodities, like oil and gold, while maintaining a 5.5% volatility target
Ticker
SPPRISME

Daily rebalancing process

Last 20-years annual returns
|
Year |
2006 |
2007 |
2008 |
2009 |
2010 |
2011 |
2012 |
2013 |
2014 |
2015 |
|
Annual Return |
2.45% |
6.59% |
10.73% |
0.44% |
4.06% |
5.29% |
8.46% |
10.98% |
6.31% |
1.47% |
|
Year |
2016 |
2017 |
2018 |
2019 |
2020 |
2021 |
2022 |
2023 |
2024 |
2025 |
|
Annual Return |
6.97% |
9.69% |
-1.24% |
9.63% |
5.61% |
10.19% |
0.35% |
1.04% |
3.99% |
-0.71% |
Annual returns reflect excess returns. Data shown is for historical purposes only, does not represent an actual account, and is not the result of any actual trading. Actual investment outcomes may vary. Historical index performance is no guarantee of any future performance. For the full backtested performance, please visit https://www.spglobal.com/spdji/en/indices/strategy/sp-prism-index/.
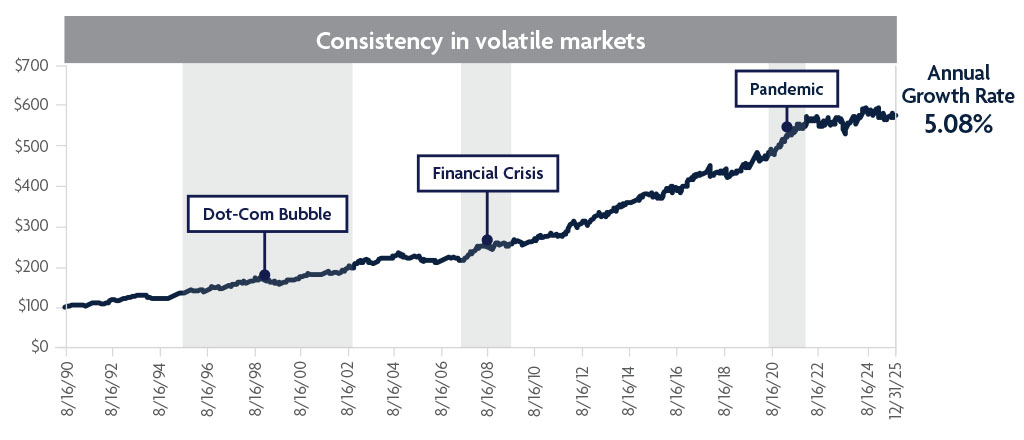
Source: S&P Dow Jones Indices LLC from 8/16/90 to 12/31/25. The index performance shown is hypothetical and for illustrative purposes only and does not represent the performance of a specific product. The S&P PRISM Index was established on 2/12/18. Performance before this date is back-tested. Hypothetical performance is back-tested by applying the Index methodology to historical financial data when all components were available and was designed with the benefit of hindsight. Back-tested performance is hypothetical and has been provided for informational purposes only. Past performance is not a guarantee of any future performance.
View the growth opportunities available with the Americo Benchmark Flex FIA crediting strategies
May not be available for use in all states

• Not a deposit • Not FDIC or NCUSIF insured • Not guaranteed by the institution • Not insured by any federal government agency • May lose value
The index is an excess return index. The returns of the index will reflect the performance of the underlying components in excess of a reference rate that could be earned on cash or a similar risk-free benchmark asset. Additionally, the performance of the index may include costs such as transaction and replication costs. These costs may vary over time with market conditions. The excess return nature of index and any costs will all reduce index performance and the potential interest credited within the annuity contract. Because the index applies a volatility control mechanism, the range of both the positive and negative performance of the index is limited.
Americo Financial Life and Annuity Insurance Company is authorized to conduct business in the District of Columbia and all states except NY.
Americo Benchmark Flex FIA Series (Policy Series: 426, 426-10 DP, 426-B, 426-10B DP, 2533, 2533 DP, 2547 PTP LCL, 2547 PTPC, 2547 PTPP, 2547 PTPTR, 2547 MYGIA. Forms ICC25 426, ICC25 426-10 DP, ICC25 426-B, ICC25 426-10B DP, ICC24 2533, ICC24 2533 DP, ICC25 2547 PTP LCL, ICC25 2547 PTPC, ICC25 2547 PTPP, ICC25 2547 PTPTR, ICC25 2547 MYGIA. AAA426, AAA426-10 DP, AAA426-B, AAA426-10B DP, AAA2533, AAA2533 DP, AAA2547 PTP LCL, AAA2547 PTPC, AAA2547 PTPP, AAA2547 PTPTR, AAA2547 MYGIA) is underwritten by Americo Financial Life and Annuity Insurance Company (Americo), Kansas City, MO, and may vary in accordance with state laws. Some products and benefits may not be available in all states. Certain restrictions and variations apply. Consult the contract and riders for all limitations and exclusions. Annexus and their affiliated agencies are independently contracted with Americo.
All guarantees and benefits of the insurance policy are subject to the claims-paying ability of the issuing insurance company. They are not backed by the broker-dealer and/or insurance agency selling the policy, or any affiliates of those entities other than the issuing company affiliates, and none makes any representations or guarantees regarding the claims-paying ability of the issuer.
The S&P 500® and S&P PRISM® Index (the “Indices”) are products of S&P Dow Jones Indices LLC or its affiliates (“SPDJI”) and have been licensed for use by Americo Financial Life and Annuity Insurance Company (“Americo”). S&P®, S&P 500®, US 500®, The 500®, iBoxx®, iTraxx® and CDX® are trademarks of S&P Global, Inc. or its affiliates (“S&P”); Dow Jones® is a registered trademark of Dow Jones Trademark Holdings LLC (“Dow Jones”). Americo’s products are not sponsored, endorsed, sold or promoted by SPDJI, Dow Jones, S&P, or their respective affiliates and none of such parties make any representation regarding the advisability of investing in such product(s) nor do they have any liability for any errors, omissions, or interruptions of the Indices.
This product does not directly participate in any stock or equity investments. Refer to your Benefits Summary & Disclosure Statement, as well as your contract, for the governing contractual provisions.
This material is not a recommendation to buy or sell an insurance product or to adopt an investment strategy. Contract owners should discuss their specific situation with their insurance professional.
This material is generic and was developed for informational purposes only. It is not intended to provide financial, legal, accounting, or tax advice. Please consult with an insurance professional regarding your situation. For legal, accounting or tax advice consult with an insurance professional or qualified professional.
©Americo
25-800-11 (01/26)